
Behind the Scenes of Controla’s Cyber Risk Model
In my opinion, most risk assessments fail because they're either too vague or too abstract. While structure and clear definitions help, we decided to solve this problem for good by combining Cyber Risk Quantification (CRQ) and attack trees. Our platform models the actual steps of how attacks actually unfold with attack trees, and then it performs a statistical analysis. I'll walk you through the underlying technology that makes this possible, from Bayesian networks to Monte Carlo simulations and show you how we quantify cyber risk.
The core: A bayesian network of attacks
At its heart, our risk engine uses a Bayesian Network, which is essentially a directed acyclic graph (DAG) that connects events (nodes) and the causal relationships between them (edges). Each node represents a specific event in the kill chain, things like "phishing email delivered," "credentials stolen," "endpoint compromised," or "data exfiltrated." Each connection then defines a conditional probability: if one step succeeds, what’s the likelihood the next one will? This structure has a few major benefits. First, it’s transparent. You can trace any number back through the graph to see exactly which probabilities led to it. Second, it’s adaptable. As new attack techniques appear, we can add or update nodes without breaking the entire model.
Here's a simple example of how this works. Let's say phishing has a 20% success rate, and if phishing succeeds, credential theft has a 60% chance of happening. The combined probability of both events occurring is 12%. Now imagine that same logic applied across dozens of nodes, each with its own uncertainty range, and you start to see why we can't just calculate this on a napkin. The interactions compound in ways that require serious computational power to map out.

Security controls also live right in this same network. Each control is mapped to reduce the probability of success for one or more nodes. For example, Multi-Factor Authentication (MFA) reduces the chance that credential phishing and password leaks will be successful. Similarly, Endpoint Detection and Response (EDR) reduces the chance of persistence or lateral movement. This approach mathematically captures "defense in depth." A control that affects multiple steps in an attack chain shows its cumulative value across the whole attack surface, rather than just being counted once in isolation.
Modeling uncertainty with the beta distribution
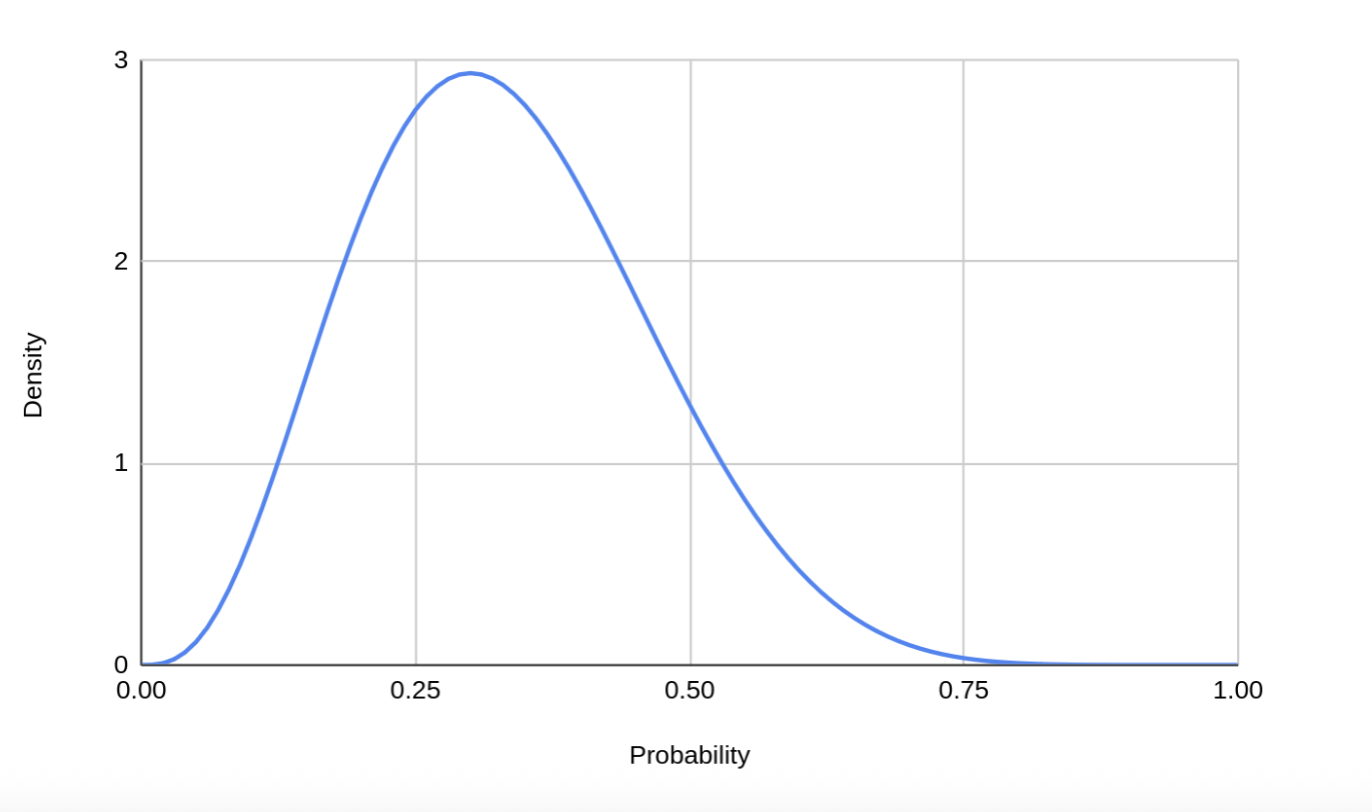
Every event in that graph, every single link in that attack chain, has uncertainty. We can’t just say, “The probability of phishing success is exactly 17.3%”. Reality doesn't work like that. Instead, we use a Beta distribution to describe each probability as a range of plausible values, weighted by how confident we are in the data. This lets us model our knowledge (or lack thereof) in an honest way. In many cases, we do have data to inform this. For example, we might have observed many attacks but no successful breaches yet. In that case, we can use something like Laplace’s Rule of Succession to adjust our starting assumptions, or priors, in a statistically sound way.
Modeling financial impact with the log-normal distribution
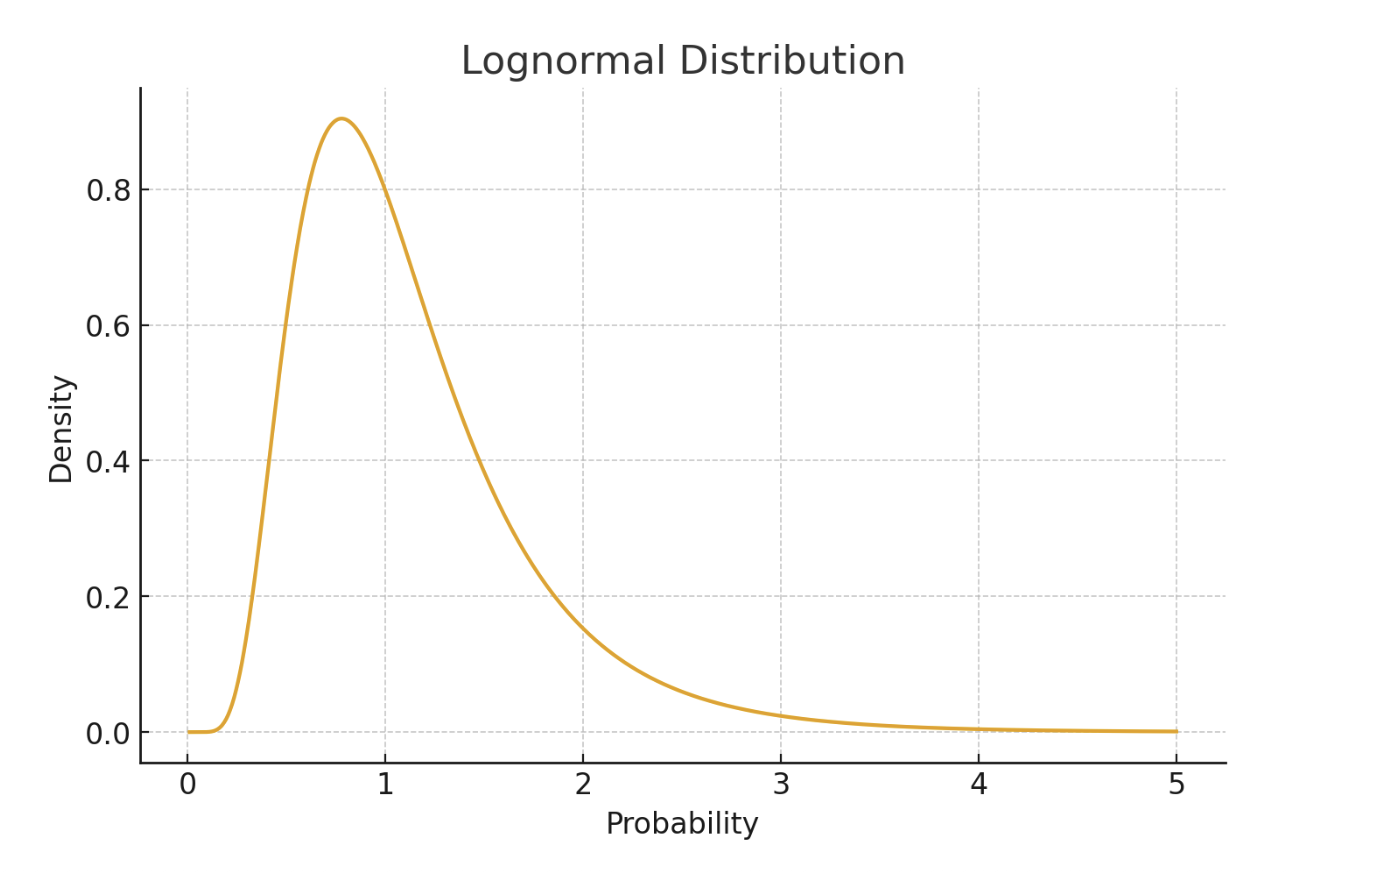
Once the attack chain reaches an impact node, say, "systems encrypted" or "customer data leaked," we need to estimate the cost. Cyber incidents have a peculiar shape when it comes to losses: most incidents are small, but a few are catastrophically expensive. That’s why we use a Log-Normal distribution for financial impact. The Log-Normal naturally captures that “long-tail” behavior, which is a situation with many small losses and a tiny probability of a massive one. We parameterize each cost distribution using empirical data, like industry averages, breach cost reports, and sector-specific adjustments.
The Monte Carlo simulation
So, we have this big, complex Bayesian network full of probability distributions and cost ranges. There is no simple, closed-form analytical solution to just "solve" it. This is where we use a Monte Carlo simulation to explore all the possible outcomes. Each simulation run goes like this:
Sample a probability for every event from its Beta distribution.
Walk through the attack graph, propagating success or failure through the network based on the probabilities it just sampled.
If a business impact node is triggered, sample a loss figure from its Log-Normal distribution.
Record the total loss for that single run.
Then we repeat this process thousands of times. The aggregate of all these runs forms a complete loss distribution. From that rich set of data, we can calculate the expected loss, percentiles (like the 95th-percentile “bad year” losses), and Conditional Value at Risk (CVaR), which tells us the average loss in the worst-case scenarios.
Data sources and priors
Of course, a model is only as good as its inputs. To build credible priors for our Beta distributions, which are our starting assumptions, we pull from a mix of empirical and industry data. We use sources like the Verizon Data Breach Investigations Report (DBIR) for attack frequencies and patterns, and data from the IRIS and Cyentia Institute for loss magnitudes and tail behavior.
Conclusion
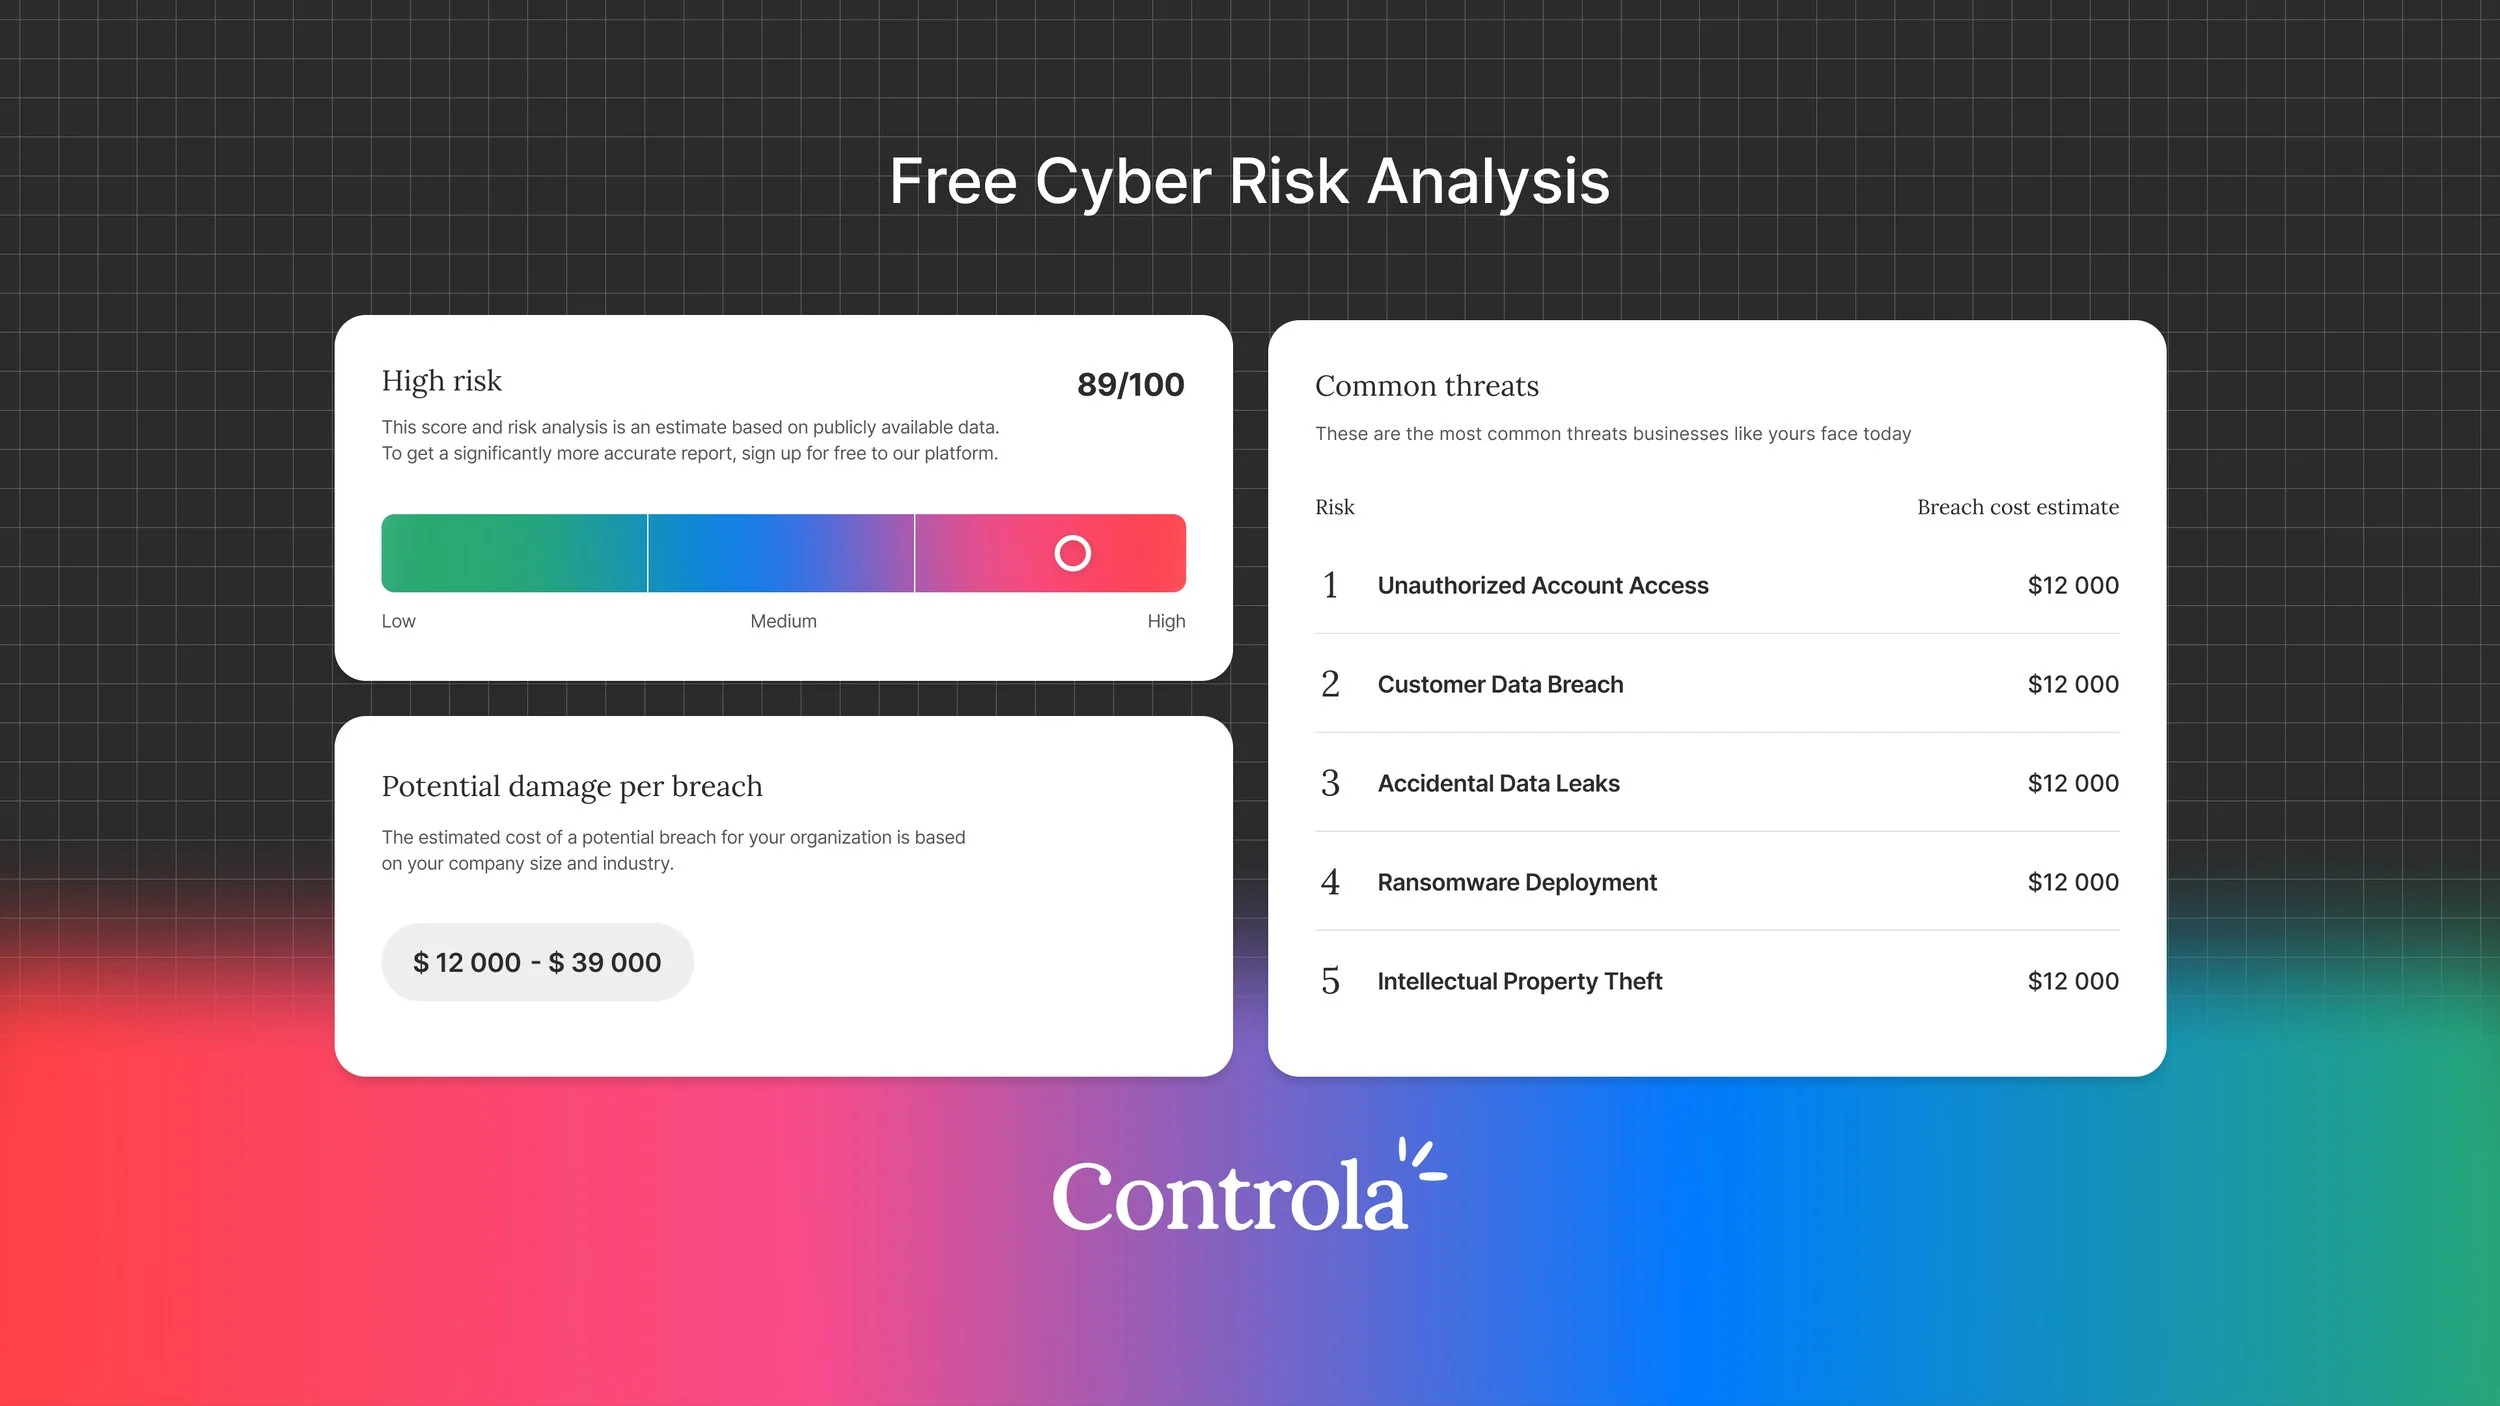
The beauty of all this complexity is that it stays hidden. What you see is simple monetary numbers to reason about. But yes, the math under the hood is complex. That complexity is actually what makes this approach more accessible. Traditional risk matrices with their vague "high, medium, low" ratings force non-technical stakeholders to interpret what those labels mean. Here, you get something concrete. A CFO understands what a 5% chance of a $2 million loss means. They can compare that to other business risks they already manage. That's the real power of this approach. It's not just about defensible numbers, it's about finally speaking a language that the entire organization can understand and act on.
Niklas Volcz, CPO Controla